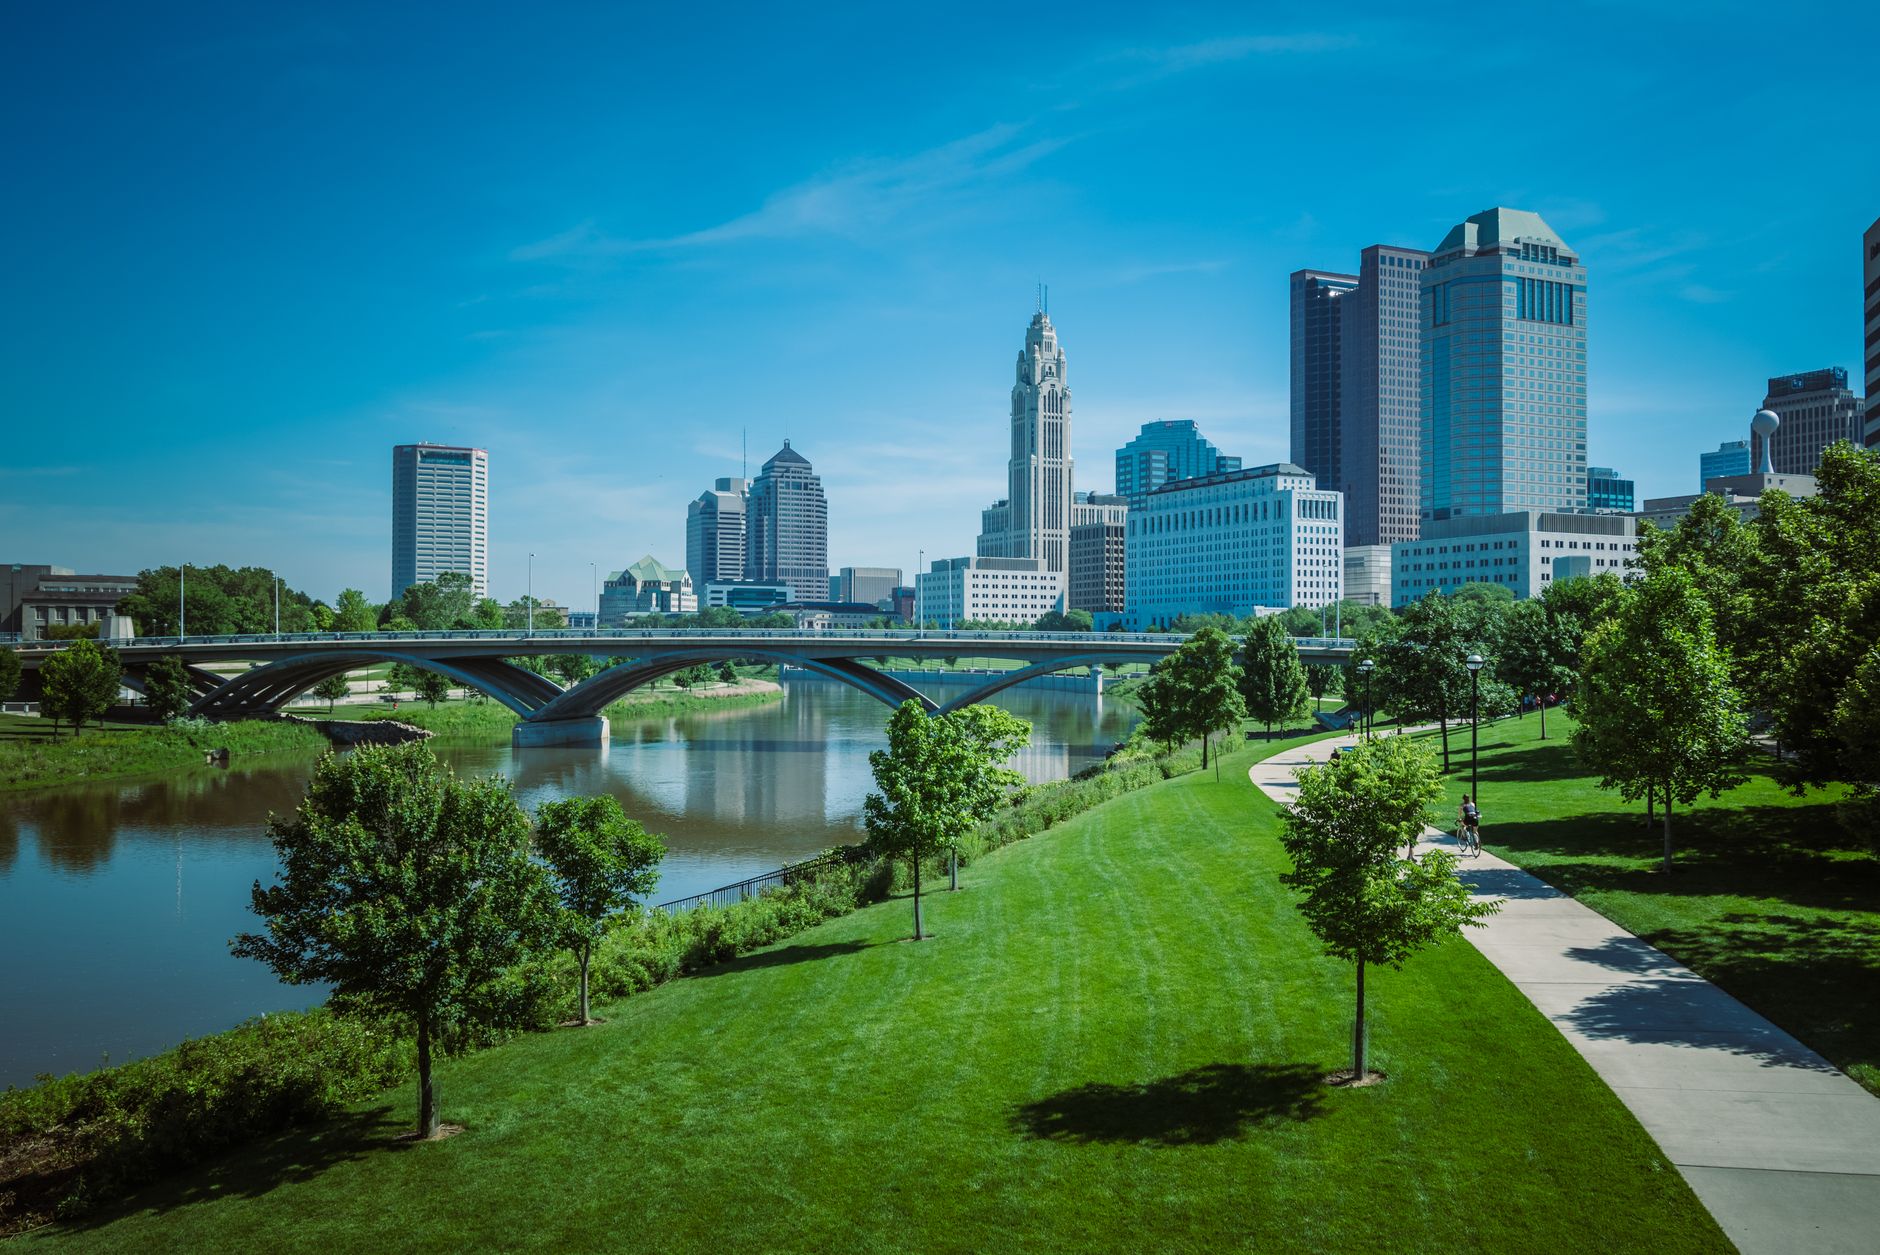
SECTOR ALPHA — SHORT NORTH
Incidents/Week4.2
Response Time8.3 min
Pattern Confidence0.87
Art district density creates false positives. Adjusting algorithm weights for gallery closures vs. actual threats.
Q132150924: Crime Mapping // Columbus Patrol Sector
Art district density creates false positives. Adjusting algorithm weights for gallery closures vs. actual threats.
Green space coverage masks thermal signatures. Night patrols require IR overlay calibration.
Transit hub variance requires dynamic reweighting. Peak hour algorithms diverge from baseline by 34%.
Low-volume sector. False negatives risk higher than Alpha. Manual override recommended quarterly.
Input sector variables. Output optimal patrol frequency (cycles/shift).